9.3 Training a network
We now know what a network computes. The question of this section is how its weights are found, and it is the part where nearly all the practical difficulties of deep learning live. A badly trained good architecture performs worse than a well trained modest one.
The principle is the one of the empirical risk minimization introduced in the previous chapter: choose the parameters that minimize the average loss on the training set. What is new is that the function to minimize is no longer convex, that it depends on millions of parameters, and that its gradient must be obtained without ever writing it down by hand.
9.3.1 Forward propagation
The forward pass is the evaluation of the network on an input. For a network with two hidden layers it is the chain:
\[\begin{align} z^{(1)}&=W^{(1)}x+b^{(1)} \quad &a^{(1)}&=g(z^{(1)}) \\ z^{(2)}&=W^{(2)}a^{(1)}+b^{(2)} \quad &a^{(2)}&=g(z^{(2)}) \\ z^{(3)}&=W^{(3)}a^{(2)}+b^{(3)} \quad &\hat y&=g_{out}(z^{(3)}) \tag{9.9} \end{align}\]
Two quantities are distinguished at every layer, and the distinction matters for what follows: the pre-activation \(z\), which is linear in the inputs of the layer, and the activation \(a=g(z)\). The pre-activations must be kept in memory during the forward pass, because the backward pass will need them. This is the reason why training a network consumes far more memory than using one.
In practice the observations are processed by blocks. If \(X\) is a matrix with one observation per row, the whole layer is a single matrix product, which is what makes these models fast on the hardware designed for that operation.
9.3.2 The loss function
The loss is chosen according to the output, exactly as in the previous chapter:
\[\begin{align} \text{regression}&: \quad L=\frac{1}{n}\sum_{i=1}^{n}(y_i-\hat y_i)^2 \\ \text{binary}&: \quad L=-\frac{1}{n}\sum_{i=1}^{n}\Big(y_i\ln\hat y_i+(1-y_i)\ln(1-\hat y_i)\Big) \\ \text{multi-class}&: \quad L=-\frac{1}{n}\sum_{i=1}^{n}\sum_{k=1}^{K}y_{ik}\ln\hat y_{ik} \tag{9.10} \end{align}\]
The pairing of the last activation with the loss is not arbitrary. When the sigmoid is combined with the log loss, or the softmax with the cross entropy, an algebraic simplification occurs that we will meet in a moment: the gradient at the output reduces to \(\hat y-y\), the error itself. The derivative of the activation, which could have been small, disappears from the expression. Pairing a sigmoid with a quadratic loss instead keeps that factor and produces a network that learns very slowly precisely when it is very wrong, which is the opposite of what we want.
9.3.3 Backpropagation
Backpropagation is nothing more than the chain rule, applied in the right order. It is worth deriving once, because everything that follows, including the vanishing gradient problem, is read directly off the formulas.
We want \(\frac{\partial L}{\partial W^{(l)}}\) for every layer. Define the error of a layer as the derivative of the loss with respect to its pre-activation:
\[\begin{equation} \delta^{(l)}=\frac{\partial L}{\partial z^{(l)}} \tag{9.11} \end{equation}\]
At the last layer the pairing announced above produces its simplification, and it is worth doing the two lines of algebra because the result is the reason that pairing is used at all.
Write \(s_k=softmax(z)_k\). Differentiating equation (9.6) gives the Jacobian of the softmax, which has two cases according to whether we differentiate a probability with respect to its own score or another one:
\[\begin{align} \frac{\partial s_k}{\partial z_k}&=\frac{e^{z_k}\sum_l e^{z_l}-e^{z_k}e^{z_k}}{\big(\sum_l e^{z_l}\big)^2}=s_k(1-s_k) \notag \\ \frac{\partial s_k}{\partial z_j}&=\frac{0-e^{z_k}e^{z_j}}{\big(\sum_l e^{z_l}\big)^2}=-s_ks_j \qquad (j\neq k) \tag{9.12} \end{align}\]
The two cases collapse into one expression, \(\frac{\partial s_k}{\partial z_j}=s_k(\mathbb{1}_{\{k=j\}}-s_j)\). Now take the cross entropy of equation (9.10) for a single observation, \(L=-\sum_k y_k\ln s_k\), and apply the chain rule:
\[\begin{align} \frac{\partial L}{\partial z_j}&=-\sum_{k=1}^{K}\frac{y_k}{s_k}\frac{\partial s_k}{\partial z_j} \notag \\ &=-\sum_{k=1}^{K}\frac{y_k}{s_k}\,s_k\big(\mathbb{1}_{\{k=j\}}-s_j\big) \notag \\ &=-\sum_{k=1}^{K}y_k\big(\mathbb{1}_{\{k=j\}}-s_j\big) \notag \\ &=-y_j+s_j\underbrace{\sum_{k=1}^{K}y_k}_{=1} \notag \\ &=s_j-y_j \tag{9.13} \end{align}\]
The label \(y\) is a one hot vector, so its components sum to one, which is what closes the calculation. In vector form:
\[\begin{equation} \delta^{(L)}=\hat y-y \tag{9.14} \end{equation}\]
Every \(s_k\) cancelled. The derivative of the activation, which will multiply the error at every hidden layer in the recurrence below, has vanished at the output. The same thing happens in the binary case: with \(\hat y=\sigma(z)\) and the log loss, \(\sigma'=\sigma(1-\sigma)\) cancels against the \(\frac{1}{\sigma}\) and the \(\frac{1}{1-\sigma}\) coming from the logarithm, and \(\frac{\partial L}{\partial z}=\sigma(z)-y\) again.
This is not a coincidence, it is a property of the exponential family: pairing a canonical link with its own log likelihood always leaves the raw residual. It is the same cancellation that produced equation (6.55) in the chapter on non linear models, where the score of the logit reduced to \(\sum_i x_i^t\big[y_i-\Lambda(x_i\beta)\big]\).
Combining equation (9.14) with the gradient formula (9.17), the derivative with respect to the weights of the last layer is
\[\begin{equation} \frac{\partial L}{\partial W^{(L)}}=\frac{1}{n}\sum_{i=1}^{n}\big(\hat y_i-y_i\big)a_i^{(L-1)t} \tag{9.15} \end{equation}\]
Setting it to zero gives the first order condition of a multinomial logit fitted on the features \(a^{(L-1)}\), which is the gradient (6.62) of the chapter on non linear models, written there as a Kronecker product rather than an outer product. Training the last layer of a classification network by gradient descent is maximum likelihood estimation of a multinomial logit. The only difference with the econometric case is that the regressors are not given, they are produced by the layers below and change at every iteration.
The pairing therefore has a practical consequence, and it is the reason it is never left to chance. Suppose we paired a sigmoid with a quadratic loss instead. The factor \(\sigma'(z)=\sigma(z)(1-\sigma(z))\) would survive, and the gradient would become \((\hat y-y)\sigma(z)(1-\sigma(z))\). Consider a network that is confidently wrong, \(y=1\) and \(z=-6\), so \(\hat y\approx 0.0025\):
| loss | gradient at \(z=-6\) | at \(z=-2\) | at \(z=0\) |
|---|---|---|---|
| cross entropy | \(0.9975\) | \(0.8808\) | \(0.5000\) |
| quadratic | \(0.0025\) | \(0.0925\) | \(0.1250\) |
With the cross entropy the gradient is largest exactly when the error is largest, which is what we want. With the quadratic loss it is four hundred times smaller, because the saturated sigmoid has flattened it: the network learns most slowly precisely when it is most wrong. The choice of the loss is not a matter of taste, it decides whether the network can recover from a bad start.
Then, for any earlier layer, the chain rule gives the recurrence that gives the method its name:
\[\begin{equation} \delta^{(l)}=\Big(W^{(l+1)t}\delta^{(l+1)}\Big)\odot g'(z^{(l)}) \tag{9.16} \end{equation}\]
where \(\odot\) is the element by element product. The error of a layer is the error of the next one, pushed back through the weights, and multiplied by the derivative of the activation. Once the \(\delta\) are known, the gradients are immediate:
\[\begin{align} \frac{\partial L}{\partial W^{(l)}}&=\delta^{(l)}a^{(l-1)t} \\ \frac{\partial L}{\partial b^{(l)}}&=\delta^{(l)} \tag{9.17} \end{align}\]
Equation (9.16) deserves to be looked at, because it contains the whole story of the next sections. Going down one layer multiplies the error by a weight matrix and by the derivative of the activation. If those factors are smaller than one, the gradient shrinks at every layer; if they are larger, it grows.
Let us implement this on a real problem, and above all verify it. A derivation can always contain a sign error, and there is a simple way to check: compare the analytic gradient with a numerical one obtained by perturbing each parameter.
In R:
set.seed(123)

# a small two class problem in two dimensions
n <- 400
Xn <- matrix(rnorm(n * 2), n, 2)
yn <- as.numeric(Xn[, 1]^2 + Xn[, 2]^2 > 1.6)   # a circular frontier

relu  <- function(z) pmax(z, 0)
drelu <- function(z) as.numeric(z > 0)
sigm  <- function(z) 1 / (1 + exp(-z))

init_net <- function(p, h, seed = 1) {
  set.seed(seed)
  list(W1 = matrix(rnorm(h * p, sd = sqrt(2 / p)), h, p), b1 = rep(0, h),
       W2 = matrix(rnorm(h,     sd = sqrt(2 / h)), 1, h), b2 = 0)
}

forward <- function(net, X) {
  Z1 <- X %*% t(net$W1) + matrix(net$b1, nrow(X), length(net$b1), byrow = TRUE)
  A1 <- relu(Z1)
  Z2 <- as.numeric(A1 %*% t(net$W2) + net$b2)
  list(Z1 = Z1, A1 = A1, Z2 = Z2, yhat = sigm(Z2))
}

loss_fn <- function(yhat, y) {
  eps <- 1e-9
  -mean(y * log(yhat + eps) + (1 - y) * log(1 - yhat + eps))
}

backward <- function(net, X, y, fw) {
  m <- nrow(X)
  d2 <- (fw$yhat - y) / m                      # delta of the output layer
  gW2 <- matrix(d2 %*% fw$A1, 1, ncol(fw$A1))
  gb2 <- sum(d2)
  d1 <- outer(d2, as.numeric(net$W2)) * drelu(fw$Z1)   # the recurrence
  gW1 <- t(d1) %*% X
  gb1 <- colSums(d1)
  list(W1 = gW1, b1 = gb1, W2 = gW2, b2 = gb2)
}

net <- init_net(2, 8)
fw  <- forward(net, Xn)
gr  <- backward(net, Xn, yn, fw)
The gradient check compares each analytic derivative with \(\frac{L(\theta+\epsilon)-L(\theta-\epsilon)}{2\epsilon}\).
num_grad <- function(net, X, y, name, i, j = NULL, eps = 1e-5) {
  bump <- function(s) {
    n2 <- net
    if (is.null(j)) n2[[name]][i] <- n2[[name]][i] + s
    else            n2[[name]][i, j] <- n2[[name]][i, j] + s
    loss_fn(forward(n2, X)$yhat, y)
  }
  (bump(eps) - bump(-eps)) / (2 * eps)
}

check <- data.frame(
  parameter = c("W1[1,1]", "W1[3,2]", "b1[2]", "W2[1,4]", "b2"),
  analytic = c(gr$W1[1, 1], gr$W1[3, 2], gr$b1[2], gr$W2[1, 4], gr$b2),
  numeric  = c(num_grad(net, Xn, yn, "W1", 1, 1),
               num_grad(net, Xn, yn, "W1", 3, 2),
               num_grad(net, Xn, yn, "b1", 2),
               num_grad(net, Xn, yn, "W2", 1, 4),
               num_grad(net, Xn, yn, "b2", 1)))
check$abs_difference <- abs(check$analytic - check$numeric)| parameter | analytic | numeric | abs_difference |
|---|---|---|---|
| W1[1,1] | 0.0002700105 | 0.0002700105 | 0e+00 |
| W1[3,2] | 0.0157562580 | 0.0157562579 | 1e-10 |
| b1[2] | 0.0483952371 | 0.0483952370 | 2e-10 |
| W2[1,4] | -0.0494579804 | -0.0494579804 | 0e+00 |
| b2 | 0.2377062059 | 0.2377062051 | 8e-10 |
The differences are of the order of the precision of the numerical approximation, which confirms that the derivation is correct. This check costs a few lines and should be performed every time a gradient is written by hand; it is the only way to distinguish a genuine bug from a network that simply learns badly.
We can now train the network and watch it learn the circular boundary.
train <- function(net, X, y, eta = .5, steps = 4000) {
  hist <- numeric(steps)
  for (s in 1:steps) {
    fw <- forward(net, X)
    hist[s] <- loss_fn(fw$yhat, y)
    g  <- backward(net, X, y, fw)
    net$W1 <- net$W1 - eta * g$W1; net$b1 <- net$b1 - eta * g$b1
    net$W2 <- net$W2 - eta * g$W2; net$b2 <- net$b2 - eta * g$b2
  }
  list(net = net, hist = hist)
}

res <- train(init_net(2, 8), Xn, yn)

gx <- seq(-3, 3, length.out = 160)
grid_dl <- as.matrix(expand.grid(x1 = gx, x2 = gx))
pgrid <- forward(res$net, grid_dl)$yhat
gdf <- data.frame(grid_dl, p = pgrid)

t1 <- ggplot(data.frame(step = seq_along(res$hist), loss = res$hist),
             aes(step, loss)) +
  geom_line(colour = "firebrick") +
  labs(title = "the loss during training") + theme_minimal()

t2 <- ggplot() +
  geom_raster(data = gdf, aes(x1, x2, fill = p), alpha = .7) +
  scale_fill_gradient2(low = "white", mid = "grey90", high = "steelblue",
                       midpoint = .5) +
  geom_point(data = data.frame(Xn, y = factor(yn)),
             aes(X1, X2, colour = y), size = .8) +
  coord_equal() + labs(title = "the boundary found") +
  theme_minimal() + theme(legend.position = "none")

t1 + t2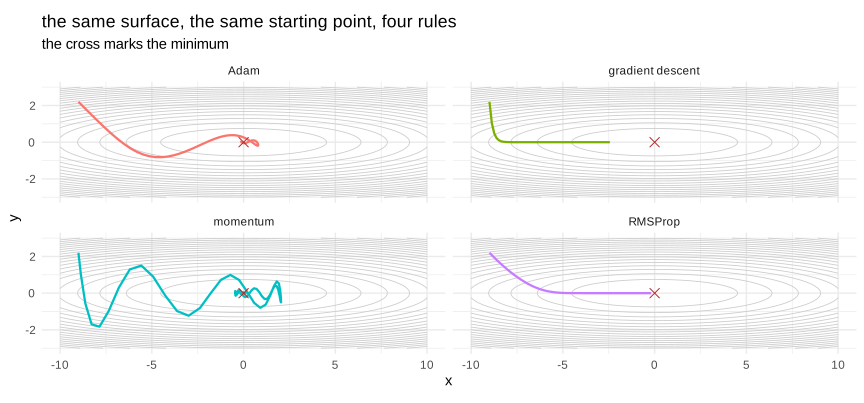
Figure 9.8: the network learns a boundary that a linear model cannot
9.3.4 Gradient descent and its variants
The update used above is the plain gradient descent, \(\theta \leftarrow \theta-\eta\,\nabla L\). It has a weakness that becomes severe in high dimension: when the loss surface is a narrow valley, steep in one direction and nearly flat in another, the gradient points mostly across the valley rather than along it, and the trajectory oscillates from one wall to the other while advancing slowly.
Four ideas, each building on the previous one, fix this.
Momentum accumulates the past gradients in a velocity, exactly as a heavy ball would keep its direction:
\[\begin{align} v&\leftarrow \beta v+(1-\beta)\nabla L \\ \theta&\leftarrow \theta-\eta v \tag{9.18} \end{align}\]
The oscillating components cancel each other between successive steps while the consistent direction adds up, so the ball rolls along the valley instead of bouncing.
RMSProp attacks the other half of the problem, the fact that a single learning rate must serve parameters with very different scales. It keeps a running average of the squared gradients and divides by its root:
\[\begin{align} s&\leftarrow \rho s+(1-\rho)(\nabla L)^2 \\ \theta&\leftarrow \theta-\frac{\eta}{\sqrt{s}+\epsilon}\nabla L \tag{9.19} \end{align}\]
Each parameter thus receives its own effective rate, large where the gradient has been small and small where it has been large.
Adam combines the two, with a bias correction for the first iterations, and is the default choice in practice:
\[\begin{align} v&\leftarrow \beta_1 v+(1-\beta_1)\nabla L, \qquad \hat v=\frac{v}{1-\beta_1^t} \\ s&\leftarrow \beta_2 s+(1-\beta_2)(\nabla L)^2, \qquad \hat s=\frac{s}{1-\beta_2^t} \\ \theta&\leftarrow \theta-\frac{\eta}{\sqrt{\hat s}+\epsilon}\hat v \tag{9.20} \end{align}\]
The recommended values, \(\beta_1=0.9\) and \(\beta_2=0.999\), work so often that they are rarely changed.
In R:
# an elongated quadratic bowl: gentle along x, steep along y
f_surf  <- function(p) 0.06 * p[1]^2 + 2.2 * p[2]^2
g_surf  <- function(p) c(0.12 * p[1], 4.4 * p[2])

run_opt <- function(kind, steps = 90, eta = .12) {
  p <- c(-9, 2.2); v <- c(0, 0); s <- c(0, 0); path <- p
  for (t in 1:steps) {
    g <- g_surf(p)
    if (kind == "gradient descent")      p <- p - eta * g
    if (kind == "momentum") { v <- .9 * v + .1 * g;  p <- p - eta * 10 * v }
    if (kind == "RMSProp")  { s <- .9 * s + .1 * g^2; p <- p - eta * g / (sqrt(s) + 1e-8) }
    if (kind == "Adam") {
      v <- .9 * v + .1 * g; s <- .999 * s + .001 * g^2
      vh <- v / (1 - .9^t); sh <- s / (1 - .999^t)
      p <- p - eta * 3 * vh / (sqrt(sh) + 1e-8)
    }
    path <- rbind(path, p)
  }
  data.frame(x = path[, 1], y = path[, 2], opt = kind, step = 0:steps)
}

paths <- do.call(rbind, lapply(
  c("gradient descent", "momentum", "RMSProp", "Adam"), run_opt))

srf <- expand.grid(x = seq(-10, 10, length.out = 160),
                   y = seq(-3, 3, length.out = 160))
srf$z <- 0.06 * srf$x^2 + 2.2 * srf$y^2

ggplot() +
  geom_contour(data = srf, aes(x, y, z = z), bins = 22,
               colour = "grey80", linewidth = .3) +
  geom_path(data = paths, aes(x, y, colour = opt), linewidth = .8) +
  # the layer needs its own data frame: a data-less layer cannot be
  # assigned to the panels of a facet
  geom_point(data = data.frame(x = 0, y = 0), aes(x, y),
             colour = "firebrick", shape = 4, size = 3) +
  facet_wrap(~ opt) + coord_equal() +
  labs(title = "the same surface, the same starting point, four rules",
       subtitle = "the cross marks the minimum") +
  theme_minimal() + theme(legend.position = "none")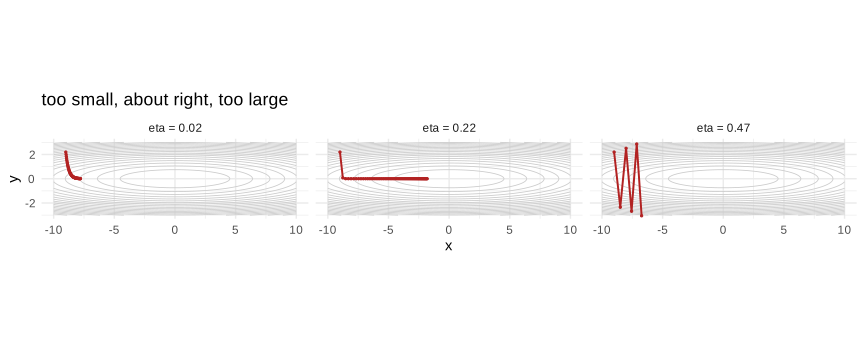
Figure 9.9: four optimizers in a narrow valley
The four trajectories start at the same place. Plain gradient descent zigzags across the valley and crawls towards the minimum. Momentum damps the oscillation and travels much further along the flat direction. RMSProp rescales the two axes and goes almost straight. Adam, combining both, reaches the neighbourhood of the minimum first.
9.3.5 The learning rate
The learning rate is the single most important hyperparameter of a network. Unlike most of the choices in this chapter it is not a matter of judgement: near a minimum there is an exact threshold above which the training cannot converge, and it is worth deriving because it explains everything the pictures below show.
Close to a minimum \(\theta^*\) any smooth loss is well described by its second order expansion. Writing \(H\) for the Hessian, which is symmetric and positive definite at a minimum, and measuring the position from the minimum:
\[\begin{equation} L(\theta)\approx L(\theta^*)+\frac{1}{2}\big(\theta-\theta^*\big)^tH\big(\theta-\theta^*\big) \tag{9.21} \end{equation}\]
The gradient is then \(\nabla L=H(\theta-\theta^*)\), and one step of gradient descent gives, again in deviation from the minimum:
\[\begin{align} \theta_{t+1}-\theta^*&=\big(\theta_t-\theta^*\big)-\eta H\big(\theta_t-\theta^*\big) \notag \\ &=\big(I-\eta H\big)\big(\theta_t-\theta^*\big) \tag{9.22} \end{align}\]
Gradient descent near a minimum is therefore a linear recurrence, and after \(t\) steps the deviation is \((I-\eta H)^t(\theta_0-\theta^*)\). This is the same object as the autoregression of the chapter on time series, and it is read the same way: through its eigenvalues.
Since \(H\) is symmetric it can be diagonalized, \(H=V\Lambda V^t\) with \(V\) orthogonal, exactly as in the principal components of the chapter on the assumptions on the regressors. Writing the deviation in that basis, \(u_t=V^t(\theta_t-\theta^*)\), the system separates completely into \(p\) independent scalar recurrences, one per eigendirection:
\[\begin{equation} u_{t}^{(i)}=\big(1-\eta\lambda_i\big)^{t}u_{0}^{(i)} \tag{9.23} \end{equation}\]
Everything now follows. The component \(i\) decays if and only if \(\lvert 1-\eta\lambda_i\rvert<1\), and this must hold for every direction at once, so the binding constraint comes from the largest eigenvalue:
\[\begin{equation} 0<\eta<\frac{2}{\lambda_{max}} \tag{9.24} \end{equation}\]
Four regimes sit inside this single inequality. For \(\eta<\frac{1}{\lambda_i}\) the component decreases monotonically. At exactly \(\eta=\frac{1}{\lambda_i}\) the factor is zero and that direction is solved in one step. Between \(\frac{1}{\lambda_{max}}\) and \(\frac{2}{\lambda_{max}}\) the factor is negative, so the trajectory alternates from one side of the valley to the other while still converging. Beyond \(\frac{2}{\lambda_{max}}\) the factor exceeds one in modulus and the loss diverges.
The figure below uses the surface \(L(x,y)=0.06x^2+2.2y^2\), whose Hessian is \(diag(0.12,\,4.4)\), so the theory predicts the three trajectories before we draw them: the threshold is \(\frac{2}{4.4}=0.4545\).
In R:
lr_run <- function(eta, steps = 60) {
  p <- c(-9, 2.2); path <- p
  for (t in 1:steps) { p <- p - eta * g_surf(p); path <- rbind(path, p) }
  data.frame(x = path[, 1], y = path[, 2],
             lab = paste("eta =", eta), step = 0:steps)
}

lr_paths <- rbind(lr_run(0.02), lr_run(0.22), lr_run(0.47))
lr_paths$lab <- factor(lr_paths$lab, levels = unique(lr_paths$lab))
lr_paths <- subset(lr_paths, abs(x) < 12 & abs(y) < 3.2)

ggplot() +
  geom_contour(data = srf, aes(x, y, z = z), bins = 22,
               colour = "grey80", linewidth = .3) +
  geom_path(data = lr_paths, aes(x, y), colour = "firebrick", linewidth = .7) +
  geom_point(data = lr_paths, aes(x, y), colour = "firebrick", size = .5) +
  facet_wrap(~ lab) + coord_equal(xlim = c(-10, 10), ylim = c(-3, 3)) +
  labs(title = "too small, about right, too large") +
  theme_minimal()
Figure 9.10: three learning rates on the same problem
The three rates are not chosen by eye, they bracket the threshold, and equation (9.23) gives the contraction factor of each direction:
| \(\eta\) | \(\lvert 1-\eta\lambda_{min}\rvert\) | \(\lvert 1-\eta\lambda_{max}\rvert\) | verdict | after 60 steps |
|---|---|---|---|---|
| \(0.02\) | \(0.9976\) | \(0.9120\) | converges | \(x:-9\to-7.79\) |
| \(0.22\) | \(0.9736\) | \(0.0320\) | converges | \(y\approx 4\times10^{-90}\) |
| \(0.47\) | \(0.9436\) | \(\mathbf{1.0680}\) | diverges | \(y\to 113.9\) |
On the left both factors are close to one and nothing moves: after sixty iterations \(x\) has travelled from \(-9\) to \(-7.9\). The training would eventually succeed, at a cost nobody would pay. In the middle, \(\eta=0.22\) is almost exactly \(\frac{1}{\lambda_{max}}=0.2273\), the value that annihilates the steep direction in a single step, which is why \(y\) has collapsed to \(10^{-90}\) while \(x\) still crawls. On the right \(\eta=0.47\) has crossed the threshold \(0.4545\): the factor of the steep direction is \(1.068>1\), so that component is multiplied by \(1.068\) at every step and the trajectory bounces between the walls while growing. The loss diverges, and no amount of patience repairs it.
The best possible rate follows from the same expression. Choosing \(\eta\) to minimize the worst factor \(\max_i\lvert 1-\eta\lambda_i\rvert\) balances the two extreme eigenvalues, which gives:
\[\begin{equation} \eta^*=\frac{2}{\lambda_{min}+\lambda_{max}} \qquad\text{with contraction}\qquad \rho^*=\frac{\kappa-1}{\kappa+1}, \quad \kappa=\frac{\lambda_{max}}{\lambda_{min}} \tag{9.25} \end{equation}\]
and this is the result that matters. The speed of gradient descent is governed not by the learning rate but by the condition number of the Hessian, the same quantity that measured multicollinearity in section 4.3.1.4. On the surface above \(\kappa=36.7\), so even at the optimal rate \(\eta^*=0.4425\) the contraction is \(0.947\): the best achievable step still removes less than six per cent of the error in the flat direction. The rate cannot be raised to fix this, because the steep direction would diverge first. One number sets both limits.
The consequence is easier to feel on real data. For the quadratic loss of an ordinary least squares the Hessian is \(X^tX\), so \(\kappa\) here is the square of the condition number of equation (4.86). On the Boston design of the previous chapter that number was \(15\,113\), hence \(\kappa=2.3\times 10^{8}\) for the Hessian: gradient descent would require a learning rate below \(1.3\times 10^{-8}\) to remain stable, and about eighty million iterations to halve the error in the worst direction. This is why nobody fits a linear regression by gradient descent when a closed form exists, and why standardizing the inputs, which is the cheapest way to pull \(\kappa\) down, is not cosmetic but the difference between a network that trains and one that does not.
It also explains the two sections that follow. Momentum and Adam exist to attack exactly this ratio, by giving each direction an effective rate of its own rather than one \(\eta\) for all of them, and batch normalization improves the conditioning of every layer for the same reason.
The threshold (9.24) is exact but not usable directly, for two reasons. The Hessian of a network has as many rows as it has parameters, so \(\lambda_{max}\) is never computed, and it is not even a fixed number: the loss surface is not quadratic, and its curvature changes as the training moves through it, so the safe rate at the first epoch is not the safe rate at the fortieth.
What survives is the shape of the result, and it is enough. Since the best rate (9.25) sits just below the point where the steep direction diverges, the practical rule is to look for that edge: try a geometric grid, \(10^{-1},10^{-2},10^{-3},10^{-4}\), and keep the largest value that still decreases cleanly. That instruction is not a heuristic, it is equation (9.25) read backwards.
The signature of each case is visible on the loss curve. A flat, slowly decreasing line means every factor \(\lvert 1-\eta\lambda_i\rvert\) is close to one, so the rate is too small. A curve that decreases then explodes, or returns NaN, means one factor has passed one: the rate is above \(\frac{2}{\lambda_{max}}\) and the steepest direction is being amplified at every step.
It is also common to decrease the rate during training, and the reason is again in equation (9.22). With mini-batches the gradient is not exact, so the recurrence carries a noise term, \(\theta_{t+1}-\theta^*=(1-\eta\lambda)(\theta_t-\theta^*)+\eta\varepsilon_t\). This is an \(AR(1)\) with an innovation, of the kind studied in the chapter on time series, and like any stationary \(AR(1)\) it does not converge to a point but to a distribution around it, whose variance is:
\[\begin{equation} Var\big(\theta_\infty\big)=\frac{\eta\,\sigma^2}{2\lambda-\eta\lambda^2}\;\approx\;\frac{\eta\,\sigma^2}{2\lambda} \tag{9.26} \end{equation}\]
The size of that residual cloud is proportional to \(\eta\). A constant learning rate therefore never converges, however long we wait: it brings the parameters into a ball around the minimum and keeps them rattling inside it. Halving the rate halves the variance of the ball, which is why \(\eta\) must be sent to zero for the iterates to settle, and it is the missing justification for the remark made in section 8.2.10. The classical condition, due to Robbins and Monro, asks that the steps be large enough in total to reach any point, \(\sum_t\eta_t=\infty\), and small enough in square for the noise to die, \(\sum_t\eta_t^2<\infty\).
The usual schedules satisfy this in practice without checking it: divide the rate by a constant every so many epochs, or follow a cosine curve towards zero.
9.3.6 Batch, epoch and mini-batch
Three words are constantly used and easily confused:
a batch is the group of observations used to compute one gradient and perform one update;
an iteration is one such update;
an epoch is one complete pass through the training set, and therefore contains \(n/\text{batch size}\) iterations.
The choice of the batch size is a compromise between two extremes. Taking the whole sample gives the exact gradient and a smooth trajectory, but one update per epoch and a prohibitive memory cost. Taking a single observation, which is the stochastic descent of the previous chapter, gives very cheap and very noisy updates. Mini-batches of a few tens to a few hundreds sit in between and are what everyone uses, also because a matrix product on a block is far more efficient on the hardware than many small ones.
The noise introduced by small batches is not only a defect. It acts as a mild regularizer and helps the trajectory escape from the poor regions of a non-convex surface, which is one reason why very large batches sometimes generalize slightly worse.
set.seed(1)
train_mb <- function(bs, epochs = 40, eta = .5) {
  net <- init_net(2, 8); hist <- c()
  for (e in 1:epochs) {
    idx <- sample(nrow(Xn))
    for (start in seq(1, nrow(Xn), by = bs)) {
      take <- idx[start:min(start + bs - 1, nrow(Xn))]
      fw <- forward(net, Xn[take, , drop = FALSE])
      g  <- backward(net, Xn[take, , drop = FALSE], yn[take], fw)
      net$W1 <- net$W1 - eta * g$W1; net$b1 <- net$b1 - eta * g$b1
      net$W2 <- net$W2 - eta * g$W2; net$b2 <- net$b2 - eta * g$b2
    }
    hist <- c(hist, loss_fn(forward(net, Xn)$yhat, yn))
  }
  data.frame(epoch = seq_along(hist), loss = hist,
             lab = paste("batch =", bs))
}

mb <- rbind(train_mb(8), train_mb(64), train_mb(400))
mb$lab <- factor(mb$lab, levels = unique(mb$lab))

ggplot(mb, aes(epoch, loss, colour = lab)) +
  geom_line(linewidth = .8) +
  labs(title = "loss per epoch for three batch sizes",
       subtitle = "small batches make more updates per epoch, and a noisier curve") +
  theme_minimal()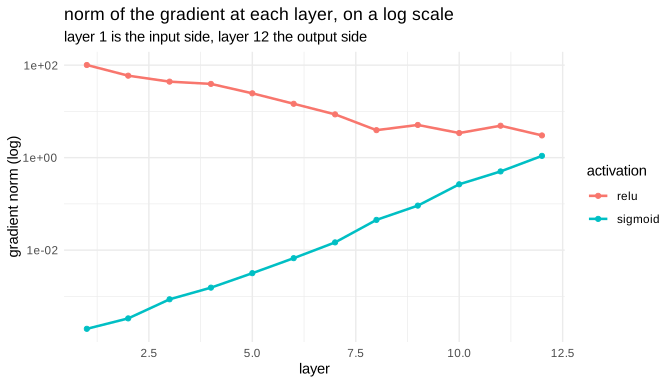
Figure 9.11: the size of the batch changes the shape of the trajectory
For an equal number of epochs, the small batch has performed fifty times more updates than the full batch and has therefore progressed much further, at the price of a visibly noisier curve. This is the usual trade, and it explains why the batch size is almost always chosen small relative to the sample.
9.3.7 Vanishing and exploding gradients
We can now return to equation (9.16) and read the consequence that blocked the field for two decades. The recurrence is applied once per layer, so unrolling it from the output down to the first layer gives a closed form. Writing \(D^{(l)}=diag\big(g'(z^{(l)})\big)\) for the diagonal matrix of the derivatives of the activation, the element by element product becomes a matrix product and
\[\begin{equation} \delta^{(1)}=\Bigg[\prod_{l=1}^{L-1}D^{(l)}W^{(l+1)t}\Bigg]\delta^{(L)} \tag{9.27} \end{equation}\]
The gradient at the first layer is therefore the error at the output pushed through a product of \(L-1\) weight matrices and \(L-1\) diagonal matrices of derivatives. Everything that follows is read off this product. Taking norms and using \(\lVert AB\rVert\leqslant\lVert A\rVert\lVert B\rVert\):
\[\begin{equation} \big\lVert\delta^{(1)}\big\rVert\leqslant\Bigg(\max_z g'(z)\Bigg)^{L-1}\prod_{l=1}^{L-1}\big\lVert W^{(l+1)}\big\rVert\;\big\lVert\delta^{(L)}\big\rVert \tag{9.28} \end{equation}\]
If the typical factor is smaller than one the bound decays geometrically in the depth: the first layers receive almost no signal and stop learning, which is the vanishing gradient. If it is larger than one the product explodes, the updates become enormous and the loss returns NaN, which is the exploding gradient. The dangerous quantity is not any single matrix but the spectral radius of their product.
The sigmoid guarantees the first case, and the reason is in its derivative. From \(\sigma(z)=(1+e^{-z})^{-1}\),
\[\begin{align} \sigma'(z)&=\frac{e^{-z}}{\big(1+e^{-z}\big)^2} \notag \\ &=\frac{1}{1+e^{-z}}\cdot\frac{e^{-z}}{1+e^{-z}} \notag \\ &=\sigma(z)\big(1-\sigma(z)\big) \tag{9.29} \end{align}\]
Now set \(s=\sigma(z)\in(0,1)\). The derivative is \(s(1-s)\), a downward parabola in \(s\) whose maximum is at \(s=\frac{1}{2}\), that is at \(z=0\), where it equals \(\frac{1}{4}\):
\[\begin{equation} \max_z \sigma'(z)=\sigma(0)\big(1-\sigma(0)\big)=\frac{1}{4} \tag{9.30} \end{equation}\]
The derivative of the sigmoid is therefore never larger than \(0.25\), and it is much smaller as soon as the neuron saturates. Substituting into the bound (9.28), the activation alone contributes a factor \(0.25^{L-1}\): with ten layers that is \(0.25^{10}\approx 9.5\times 10^{-7}\), so the weights would have to be large enough to multiply the gradient back up by a million merely to keep it at its original size. This is the whole difficulty in one number.
The hyperbolic tangent improves the constant without repairing the mechanism. Since \(\tanh'(z)=1-\tanh^2(z)\), its maximum is \(1\), attained at \(z=0\). That is four times better than the sigmoid, but still at most one: the product in (9.27) can be held steady, never amplified, and any saturation pushes it down again. The ReLU is the first activation to break out, because its derivative is exactly \(1\) wherever the unit is active, so \(D^{(l)}\) becomes a matrix of zeros and ones and the surviving paths pass the gradient through undiminished. That single property is why the bound stopped biting and depth became trainable.
A reader coming from the earlier chapters will recognize the condition. Equation (9.27) is a product of matrices repeated across layers, exactly as the powers of the companion matrix in section 7.7.1 are a product repeated across time, and in both cases the behaviour is decided by whether the eigenvalues sit inside or outside the unit circle of equation (7.10). The two fields want opposite answers. The econometrician wants the eigenvalues inside the circle, so that shocks fade, the variance is finite and inference is valid. The engineer fights to keep them on it, because a signal from the first layer has to reach the last. Same condition, opposite verdict. Section 9.6.3 makes the correspondence exact, because a recurrent network repeats the same matrix and is therefore, term for term, an autoregression.
The measurement below makes the phenomenon concrete.
In R:
set.seed(1)

grad_profile <- function(activation, L = 12, width = 24) {
  g  <- switch(activation,
               sigmoid = function(z) 1 / (1 + exp(-z)),
               relu    = function(z) pmax(z, 0))
  gp <- switch(activation,
               sigmoid = function(z) { s <- 1 / (1 + exp(-z)); s * (1 - s) },
               relu    = function(z) as.numeric(z > 0))

  x <- matrix(rnorm(width), 1, width)
  Ws <- lapply(1:L, function(i) matrix(rnorm(width * width, sd = .5), width, width))
  Zs <- vector("list", L); A <- x
  for (l in 1:L) { Zs[[l]] <- A %*% Ws[[l]]; A <- g(Zs[[l]]) }

  delta <- matrix(rnorm(width), 1, width)      # an arbitrary error at the output
  norms <- numeric(L)
  for (l in L:1) {
    delta <- delta * gp(Zs[[l]])
    norms[l] <- sqrt(sum(delta^2))
    delta <- delta %*% t(Ws[[l]])
  }
  data.frame(layer = 1:L, norm = norms, activation = activation)
}

prof <- rbind(grad_profile("sigmoid"), grad_profile("relu"))

ggplot(prof, aes(layer, norm, colour = activation)) +
  geom_line(linewidth = .9) + geom_point() +
  scale_y_log10() +
  labs(title = "norm of the gradient at each layer, on a log scale",
       subtitle = "layer 1 is the input side, layer 12 the output side",
       y = "gradient norm (log)") +
  theme_minimal()
Figure 9.12: the gradient across the layers of a deep network
The vertical scale is logarithmic, and a straight line on it is an exponential decay. With the sigmoid the gradient loses several orders of magnitude between the output and the input, so the early layers are effectively frozen. With the ReLU the profile is far flatter.
Four remedies are used, and we have already met or will meet all of them: the ReLU family, which keeps a derivative of one; a careful initialization, treated next; batch normalization, which rescales the pre-activations at every layer; and the residual connections, which add a shortcut \(a^{(l+1)}=a^{(l)}+f(a^{(l)})\) so that the gradient has a path of multiplier one back to the early layers. That last idea is what made networks of hundreds of layers trainable.
For the exploding case the standard remedy is simpler still: gradient clipping, which rescales the gradient whenever its norm exceeds a threshold.
9.3.8 The initialization of the weights
The starting point matters, and for a reason that follows the same arithmetic. Two naive choices fail immediately.
Initializing every weight to zero makes all the neurons of a layer compute the same thing, receive the same gradient and stay identical forever: the layer behaves like a single neuron. This is the symmetry problem, and it is why the initialization must be random.
Initializing with a variance that is too large or too small makes the activations grow or shrink at every layer, and the gradient with them. The sensible rule is to choose the variance so that the signal keeps roughly the same magnitude from one layer to the next, which gives:
\[\begin{align} \text{Xavier (for tanh)}&: \quad Var(w)=\frac{2}{n_{in}+n_{out}} \\ \text{He (for ReLU)}&: \quad Var(w)=\frac{2}{n_{in}} \tag{9.31} \end{align}\]
The He variant carries a factor two because the ReLU sets half of its inputs to zero and therefore halves the variance of the output.
In R:
set.seed(1)
prop_act <- function(sd_w, label, L = 8, width = 200) {
  A <- matrix(rnorm(width), 1, width)
  out <- data.frame()
  for (l in 1:L) {
    W <- matrix(rnorm(width * width, sd = sd_w), width, width)
    A <- pmax(A %*% W, 0)
    out <- rbind(out, data.frame(layer = l, sd = sd(as.numeric(A)), kind = label))
  }
  out
}

w <- 200
ini <- rbind(
  prop_act(0.02,             "too small"),
  prop_act(sqrt(2 / w),      "He (2/n_in)"),
  prop_act(0.2,              "too large"))

ggplot(ini, aes(layer, sd, colour = kind)) +
  geom_line(linewidth = .9) + geom_point() +
  scale_y_log10() +
  labs(title = "standard deviation of the activations, layer by layer",
       y = "sd (log scale)") +
  theme_minimal()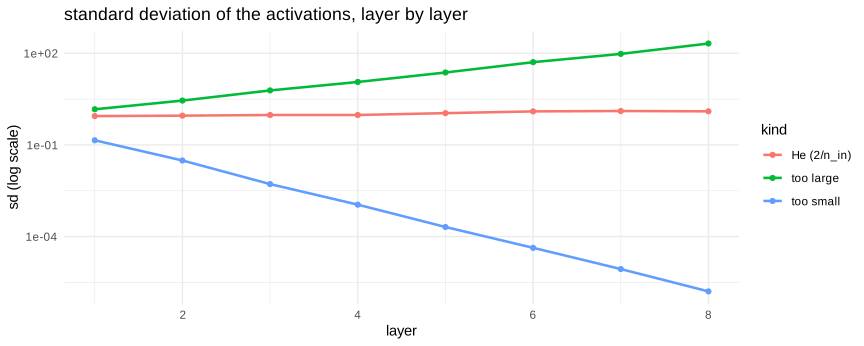
Figure 9.13: the distribution of the activations through the layers
With a variance that is too small the signal dies out after a few layers and nothing reaches the output. With a variance that is too large it grows until it saturates the arithmetic. The He initialization keeps it almost constant, which is exactly what it was designed for. The same three curves would be obtained for the gradient on the way back, which is why this choice matters so much.
In Python:
Everything written by hand above is available in one line in a framework. We use PyTorch, whose automatic differentiation computes the backward pass for any expression we write.
#> <torch._C.Generator object at 0x000002C890ABD510>
Xt = torch.tensor(np.asarray(Xn_py), dtype=torch.float32)
yt = torch.tensor(np.asarray(yn_py), dtype=torch.float32).view(-1, 1)

model = nn.Sequential(
    nn.Linear(2, 8),
    nn.ReLU(),
    nn.Linear(8, 1),
)
loss_fn_t = nn.BCEWithLogitsLoss()          # sigmoid and log loss combined
opt = torch.optim.Adam(model.parameters(), lr=0.05)

hist = []
for step in range(1500):
    opt.zero_grad()
    out = model(Xt)
    loss = loss_fn_t(out, yt)
    loss.backward()                          # the whole backward pass
    opt.step()
    hist.append(loss.item())

acc = ((torch.sigmoid(model(Xt)) > .5).float() == yt).float().mean().item()
torch_tab = pd.DataFrame({"final_loss": [round(hist[-1], 4)],
                          "accuracy": [round(acc, 4)],
"parameters": [sum(p.numel() for p in model.parameters())]})| final_loss | accuracy | parameters |
|---|---|---|
| 0.0044 | 1 | 33 |
The three lines loss.backward(), opt.step() and opt.zero_grad() replace the whole backward function we wrote above. It is worth remembering what they hide: backward walks the graph of operations in reverse and applies equation (9.16) at every node, step applies the update rule of the chosen optimizer, and zero_grad erases the gradients of the previous iteration, because PyTorch accumulates them by default. Forgetting that last call is the most common beginner’s mistake, and it produces a network that seems to train and does not.
#> <Figure size 600x300 with 0 Axes>#> [<matplotlib.lines.Line2D object at 0x000002C9A465ECC0>]#> Text(0.5, 0, 'iteration')
#> Text(0, 0.5, 'loss')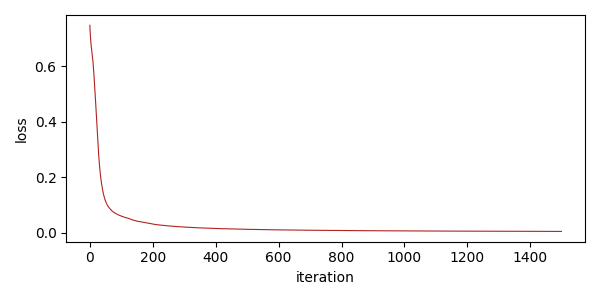
Figure 9.14: training a network with PyTorch